Ray Lutz: "Paper Ballots Only Protect Elections If We Look at Them...Significant effort goes into securing paper ballots: controlled ballot stock, chain-of-custody procedures, sealed containers, and retention requirements. But these safeguards only matter if ballots are actually examined.”
Tennessee’s December 2 Election: Were the Results Accurate?
The Case for an Audit: A 9-point loss after a 22-point landslide. What was the true margin?
RAY LUTZ
DEC 24
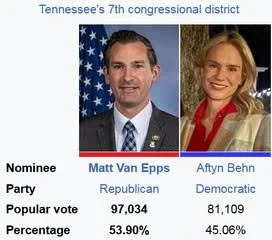
On December 2, Tennessee held a special election in the 7th Congressional District. The reported result showed Aftyn Behn losing by 9 percentage points, a substantial improvement over Donald Trump’s 22-point margin in the same district in 2024. That shift was widely interpreted as a political success. What has not been examined is whether the reported result, and the reported margin, are accurate. Despite the existence of paper ballots and a paper audit trail, no meaningful audit was conducted. This article explains why that matters, what Tennessee law allows and prohibits, and why outcome-only audits are not sufficient to answer the most important questions raised by this election.
Summary of points in this article:
Creating a paper record can detect machine errors, but only if it is adequately checked
No audits were performed in TN for the Dec 2 election due to legal constraints.
The machines in TN include some of the worst, yet some of the best.
An RLA audit would be feasible in this election.
The Risk Limit in RLA audits is only about the sample sizes, not all risks.
The RLA audit would clarify who won and lost, but not by how much.
Ballot Image Audits (BIAs) can clarify whether the margin of victory was correct.
We should attempt to do a BIA of Williamson county
We must push for hand-marked ballots in 10 of these 14 counties, and retire the pushbutton with VVPAT machines.
In the future, all ballot images should be saved and made available for public review.
Creating a paper record can detect machine errors, but only if it is adequately checked
Paper ballots make verification possible only if someone actually looks at them. Without audits, the paper record functions largely as an emergency backup rather than an active safeguard. That backup role still matters because machines can fail catastrophically, but failing to examine ballots leaves the public with little more than trust in software-reported totals.
No Audits Are Being Performed in Tennessee for the December 2 Election
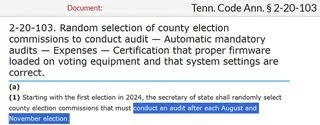
For the December 2 election, no audit is required by Tennessee law. The statutes mandate audits only for elections held in August and November, not for those conducted in December.
In practice, election officials interpret these provisions not merely as defining what must occur, but as setting the outer limits of what is permitted. If the code does not explicitly require an audit, it is treated as if audits are not allowed at all. As a result, even straightforward post-election verification is avoided.
The sections that follow examine Tennessee’s election audit statutes and explain how this interpretation has effectively eliminated audits for the December 2 election.

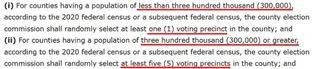
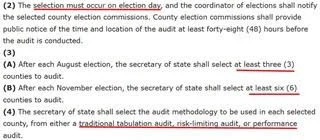
From the statutory language shown below, several additional limitations become clear. Even when audits are conducted, they involve only a small fraction of the state. Depending on the provision applied, just 3 or 6 counties out of 95 are selected for review.
The statute indicates that the Secretary of State selects these counties at random on election day. From an audit-design perspective, this timing is problematic. Ideally, selection should occur only after all results are finalized and frozen, so no county knows in advance whether it will be audited. Advance knowledge undermines the deterrent value of audits by allowing jurisdictions to anticipate scrutiny.
The code does not clearly specify when on election day the selection occurs. Given typical administrative practice, it is reasonable to assume the selection is made early, possibly at the start of the day. If so, counties would know well in advance whether their work will be reviewed, further weakening the audit’s effectiveness.

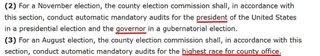
The next clip shows an additional constraint. In November elections, only a single contest is audited, either the presidential or gubernatorial race. In August elections, the audit is limited to the top county-level contest.
In each case, only one contest is examined, and election officials know in advance exactly which contest it will be. This advance certainty further limits the audit’s value, as it narrows both the scope of review and the uncertainty that audits are meant to introduce.

The workload is reduced even further by limiting the number of precincts audited. As shown below, counties audit either 1 or 5 precincts.
Only the 5 largest counties—Shelby, Davidson, Knox, Hamilton, and Rutherford—are classified as large counties and are required to audit 5 precincts. The remaining 90 counties, if selected at all, audit just a single precinct.
In practical terms, this produces extremely low coverage. In Shelby County, with approximately 907,000 residents and about 540,000 registered voters—roughly 400,000 of whom turn out—auditing 5 precincts amounts to coverage on the order of 0.1 percent. A more typical benchmark is closer to 1 percent.
A more defensible approach would scale the audit to a percentage of precincts rather than a fixed number, ensuring that audit coverage grows with county size rather than shrinking in relative terms.
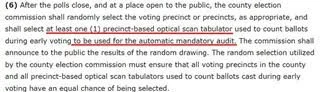
The process then calls for one or more machines to retabulate the selected precincts. Critically, the machine used for this retabulation is one that was already used during early voting.
As a result, any configuration errors shared across machines would not be detected by this process. The audit does not introduce an independent tabulation method; it simply repeats the count using similar equipment.
Absentee and early-voted ballots are handled in the same manner, rescanned using scanners already deployed for that category. This further limits the audit’s ability to detect systematic errors affecting the original counts.
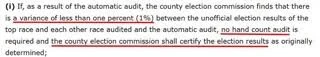
The process also assumes, implicitly, that all margins of victory exceed 1 percent. Discrepancies are not investigated unless the difference between the retabulation and the original results exceeds that threshold.
This creates a serious blind spot. Consider a contest decided by a 0.3 percent margin. If a retabulation using another machine differs from the original count by 0.5 percent, the reported outcome could be wrong. Yet because the discrepancy is below the 1 percent trigger, the results are still certified.
In close races, this policy allows potentially outcome-altering errors to pass without further review.

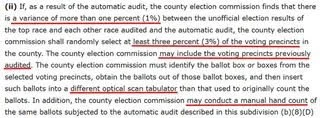
If they find a variance of more than 1%, then they can rescan 3% of those or other precincts using a different machine or do a hand count.

They also conduct performance audits, which verify that procedures were followed but do not examine election results.
Although risk-limiting audits are mentioned, the statutes provide no detail describing how such audits would be conducted.
Taken together, the weaknesses in Tennessee’s audit framework can be summarized as follows:
• Audits are required only for August and November elections.
• The December 2 election is therefore not audited at all.
• Even when audits occur, only 3 or 6 counties participate, and those counties may be identified before polls close and before results are frozen, eliminating the element of surprise.
• In November elections, only the gubernatorial or presidential contest is audited; in August elections, only the top county office on the ballot is reviewed. Other contests are not automatically checked, even though configuration errors or malicious interference could affect any contest in any county.
• Within a selected county, only a small number of precincts are audited.
• The audit consists of rescanning ballots using machines that were already used in the same election, likely with the same configuration and the same potential errors.
• If the audit reveals discrepancies of up to 1 percent, no further action is required, even if the margin of victory is far smaller. While this is not a concern in the December 2 election, which had a 9 percent margin, it is critical in closer races.
• If discrepancies exceed 1 percent, officials are only required to rescan the ballots again and possibly expand the audit to a few additional precincts. A hand count is never mandated.
• The statutes do not provide a detailed or operational description of a risk-limiting audit.
The Machines Used in Tennessee Include Some of the Worst, Yet Some of the BestMachine Types
Tennessee uses a wide variety of voting systems, ranging from some of the most outdated technologies still in service to systems that are comparatively strong from an auditability standpoint.
At the low end are legacy DRE (direct-recording electronic) pushbutton machines. These systems do not produce conventional paper ballots and have instead been retrofitted with VVPAT devices, or Voter-Verifiable Paper Audit Trails. The VVPAT prints the voter’s selections onto a narrow paper tape, similar to a cash-register receipt. Voters can view this tape through a window, and in theory it can later be audited.
In practice, however, this assurance is largely illusory. If no audits are performed, the VVPAT serves no verification function at all. The paper exists, but it is never meaningfully examined.
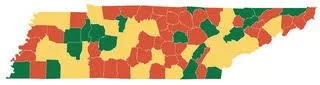
Across the state’s 95 counties, roughly one-third still rely on these pushbutton systems, shown in red in the map below. Counties using ballot-marking devices with touch-screen interfaces that produce paper records containing barcodes are shown in yellow. Counties that primarily use hand-marked paper ballots—where voters darken ovals directly on the ballot—are shown in green.
This diversity of systems has direct consequences for auditability and public confidence, especially in the absence of mandatory post-election verification.
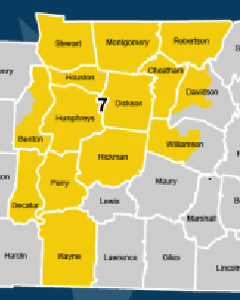
Tennessee’s 7th Congressional District includes 11 counties in their entirety and portions of 3 additional counties. The partial counties are clustered around Nashville in Davidson County and extend south into Williamson County.
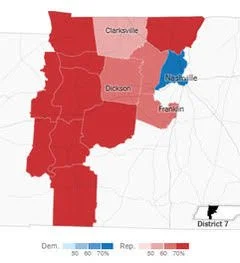
Williamson County, a Democratic stronghold, is divided in a manner that appears designed to ensure the 7th District remains reliably controlled by the Republican Party. This configuration reflects the effects of partisan gerrymandering on the district’s composition and electoral outcomes.
See NYTimes summary here: https://www.nytimes.com/interactive/2025/12/02/us/elections/results-tennessee-us-house-7-special.html


Votes Cast % of total Machine type
65,367 36.32% MicroVote Infinity (DRE Pushbutton)
91,097 50.61% ES&S ExpressVote + DS200
11,947 6.64% Unisyn OpenElect Optical (OVO)
11,585 6.44% Hart Intercivic Verity Scan
MicroVote Infinity (DRE Pushbutton)
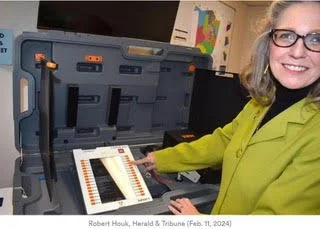
The worst of the systems used in the 7th Congressional District is the MicroVote Infinity, a pushbutton DRE machine that can be outfitted with a VVPAT (Voter Verifiable Paper Audit Trail) device. The VVPAT printer, visible just beyond the voter’s arm in the image below, produces a continuous paper tape recording the voter’s selections which the voter can verify when they vote.
If no one compares the VVPAT tape to the data uploaded into the Election Management System (EMS), the reported totals in the EMS can be altered without meaningful constraint. In this election, approximately 16,000 votes were reported for Van Epps over those reported for Behn. Given that 65,367 votes were cast on these machines, that outcome could easily be reversed by manipulation or misconfiguration affecting only a fraction of the totals.
Although the VVPAT is often described as providing a “paper record,” that assurance is meaningless when no audits are conducted. In this election, nothing is checked.
Even if officials wanted to examine ballots from the VVPAT tapes, doing so would be logistically difficult. A truly random selection would require generating a random index and physically counting forward on the tape to reach that ballot. Because the tape is continuous, it tends to unspool uncontrollably, making handling and preservation challenging. When California still permitted these systems, the law required a 100% hand count of the tapes. Some counties resorted to using custom jigs to keep the tape aligned while unrolling it from start to finish.
These machines do not produce ballot images, and creating them would require specialized scanners capable of handling continuous tape media and a lot of work.
For additional technical details on the MicroVote Infinity system, see: https://verifiedvoting.org/election-system/microvote-infinity/

ES&S ExpressVote BMDs + DS200 scanners
About half of the ballots in the 7th Congressional District across 6 counties were cast using a combination of ES&S ExpressVote ballot-marking devices and DS200 scanners.
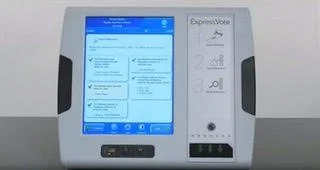
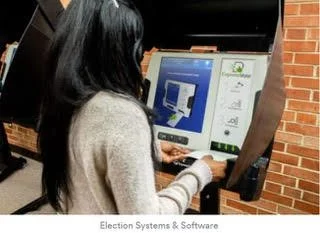
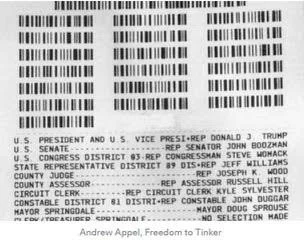
The ExpressVote is a touch-screen BMD (ballot marking device). Voters make their selections using the on-screen interface, shown in the first image, and then print a ballot summary sheet. This is a narrow, half-sheet paper ballot containing both human-readable text and barcodes.


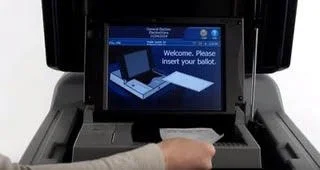
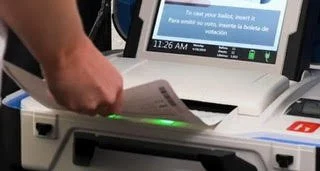
The printed summary sheet is then inserted into a DS200 scanner. The scanner reads the barcode to tabulate the vote and generates both aggregated totals for that machine and a ballot image of the summary sheet. At the close of voting, the memory card from each DS200 is removed and returned to the election office, where the results are uploaded into the Election Management System (EMS).
Because ballot images are created, these systems support ballot image audits, which can be used to compare reported results against recorded voter intent at scale.
There is one important caveat: these machines allow ballot image saving to be disabled. If that option is not enabled, the auditability advantage of this system is largely lost.
Even though there is a paper record and ballot images of this ballot that are created, if they are never reviewed, then again, the totals in the EMS can be changed without any limit.
Unisyn OpenElect Optical (OVO) and Hart Intercivic Verity Scan
The Unisyn OpenElect Optical (OVO) and the Hart Intercivic Verity Scan systems both use hand-marked paper ballots and represent the stronger end of the technology spectrum used in the district. Each accounts for roughly 6 percent of the vote, with Unisyn used in 1 county and Hart Intercivic used in 3 smaller counties.
These systems are similar in design and operation. They are not BMDs that rely on barcodes, and they are not DRE systems retrofitted with VVPAT devices. Voters mark paper ballots directly, which are then scanned optically. This is good.
Both systems produce ballot images, making them well suited for ballot image audits. From a technical standpoint, they support meaningful post-election verification.

Unisyn OpenElect Optical (OVO)
Hart Intercivic Verity Scan
Even so, sound technology alone does not ensure accuracy. Without audits, even the best systems provide no verified assurance that the reported results reflect voter intent.
An RLA Audit Would Be Feasible in This Election
With a reported margin of approximately 9 percent, this contest is especially well suited for a ballot-polling risk-limiting audit. Verifying the outcome—who won and who lost—would require examining only a small number of paper ballots.
A district-wide RLA would require on the order of 400 ballots drawn randomly across all or part of the 14 counties in the district. On average, that is about 29 ballots per county, with sample sizes ranging from roughly 4 ballots in the smallest counties to about 96 in the largest. This is a modest effort with a high return in assurance.
What a Risk-Limiting Audit Actually Does
A risk-limiting audit is a statistically guaranteed check of an election outcome. It is designed so that:
• If the reported outcome is wrong, the audit has at most a small probability—called the risk limit—of failing to detect the error.
• If the reported outcome is correct, the audit usually stops after examining only a small, random sample of ballots.
• Unlike fixed-percentage audits, RLAs scale with the closeness of the race. Narrow margins require more ballots; wide margins require fewer.
In this contest, the margin is large enough that a ballot-polling RLA would conclude quickly.
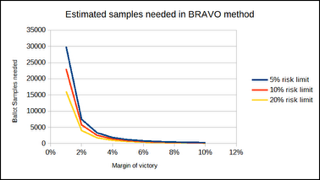
The BRAVO¹ method uses this formula for estimating the expected number of ballots needed is:
Where:
• alpha is the risk limit (commonly 5%)
• m is the margin as a fraction (0.09)
For a 5% risk limit, the expected sample size is about 400 ballots district wide (14 counties)
For a 5 percent risk limit, the expected sample size is approximately 400 ballots district-wide, spread across 14 counties. This is an extraordinarily small burden for what it provides: statistical confirmation that the reported outcome is correct.
Why Audit a Race with a Large Margin?
This question comes up frequently, and the answer is straightforward:
• Audits are not just for close races, they are for all races.
• The purpose is to verify the process, not the competitiveness.
• Conducting RLAs routinely builds institutional competence and public confidence.
• Any problems uncovered (even small ones) help strengthen future elections.
In this election, the margin of victory in raw votes was about 16,000. Altering a computerized result does not require changing ballots; it only requires modifying a few numbers in a spreadsheet. Without audits, those numbers can be changed without detection.
Just as financial statements are audited every year regardless of profit margin, election results deserve verification in every cycle.
Paper Ballots Only Protect Elections If We Look at Them
Significant effort goes into securing paper ballots: controlled ballot stock, chain-of-custody procedures, sealed containers, and retention requirements. But these safeguards only matter if ballots are actually examined.
Without audits:
• The paper record is unused.
• Confidence depends on trusting software totals.
• The public loses visibility into a process that should be open and verifiable.
With such a favorable statistical environment—large margin, small sample size, straightforward logistics—this election represents an unusually efficient opportunity to demonstrate a modern, evidence-based audit.
If the state does not conduct an RLA, the public loses:
• A scientifically sound confirmation of results
• An opportunity to normalize and refine best-practice audits
• A moment to show that verification is routine, not exceptional
Audits are not about suspicion.
They are about good governance, transparency, and accountability.
The table below provides a convenient reference for estimating the number of samples required for a risk-limiting audit using the BRAVO ballot-polling method.
If there is any indication that the reported loser may in fact be the true winner, additional ballots will be required, potentially doubling the initial estimate. This reflects how RLAs respond to conflicting evidence by expanding the sample until the outcome is resolved
A technical note is important here. The BRAVO method simplifies the mathematics by assuming ballots are sampled with replacement, meaning the same ballot could theoretically be selected more than once. This assumption is used only for statistical convenience. In practice, ballots must never be resampled, or the audit could fail to converge if significant discrepancies are present.
The table also illustrates how sharply the required sample size increases as margins narrow. Margins above 2 percent require relatively modest samples, while margins below 2 percent grow rapidly. At a 9 percent margin, very few ballots are needed to confirm the outcome. Although the calculation yields an estimate of 370 ballots, it is prudent to plan for at least 10 percent more in the initial draw to avoid the need for additional sampling.
Margin 5% risk limit 10% risk limit 20% risk limit
0.01 29,957 23,026 16,094
0.02 7,489 5,757 4,023
0.03 3,329 2,558 1,788
0.04 1,872 1,439 1,006
0.05 1,198 921 644
0.06 832 639 447
0.07 612 470 329
0.08 468 360 252
0.09 370 284 199 ← This case
0.10 300 230 161
The method itself is straightforward. Ballots are randomly selected, and the vote on each sampled ballot is recorded and the margin calculated. After the initial sample is examined, the statistical risk is evaluated. If the calculated risk falls below the chosen limit, the audit stops.
In this case, the number of ballots drawn from each county would likely range from about 4 to 96, selected randomly from all ballots cast. The variation reflects differences in turnout, with roughly 1 ballot sampled for every 450 ballots cast across the district.
Conceptually, this is similar to an election poll, except that instead of asking voters how they voted, the audit examines the ballots themselves. Sampling continues only until the uncertainty is low enough to confirm the outcome. The key comparison is between the reported margin of victory and the margin observed in the sample, and the audit stops only when the evidence shows that the paper ballots support the computer-reported result.
Other RLA Methods Do Exist
There are several forms of risk-limiting audits, each with different requirements and efficiencies.
The method described above is known as a ballot-polling RLA. One advantage of this approach is that it does not require a cast vote record (CVR) that lists individual ballots. Ballots are sampled directly and interpreted by hand, making this method usable even in jurisdictions without ballot-level digital records.
If a jurisdiction can reliably match each paper ballot to its corresponding CVR, a ballot-comparison RLA² becomes possible. This method is generally more efficient, requiring fewer ballots, because it compares each sampled ballot directly against the machine-recorded vote.
Another commonly used approach is the batch-comparison audit. In this case, vote totals are compared at the batch level rather than ballot by ballot. Many election offices find this method easier to administer because it closely resembles a traditional recount process and aligns with existing procedures. However, it typically requires examining more ballots than a ballot-comparison audit.
“Risk Limit” does not limit all risks
It is important to understand what the term risk limit actually means. It does not mean that all risks are limited to that value. The risk limit applies only to the additional uncertainty introduced by sampling.
Because an RLA examines only a subset of ballots, there is some chance that the sample could indicate the outcome is correct when it is not. The stated risk limit bounds only that probability. It does not account for other sources of risk in the election process.
For example, RLAs do not address the risk that ballots were added or removed, that some ballots were never included in the count, or that ballots were altered while in storage. Paper marks could be changed by someone with access, such as darkening ovals or creating overvotes. Ballots could be invalid, or ballot boxes could be stuffed. The actual audit itself could be performed incorrectly. None of these risks are included in the RLA risk limit.
In that sense, RLAs can be thought of as “risk-taking audits.” The risk limit represents the additional risk accepted due to sampling, layered on top of all other risks that may already exist.
This is why RLAs must be part of a broader verification framework. Other risks must be reduced as much as possible through reconciliation checks, such as matching the number of ballots to the number of voters who signed in, verifying chain of custody, and enforcing secure storage. While it may be impossible to eliminate every risk, sampling risk should not be confused with total election risk.
Multiple Contests
This election contained only a single contest on the ballot. That simplicity makes the statistical analysis straightforward, because the required sample size depends only on the margin in that one race.
Most elections are far more complex. They can contain hundreds of contests, even though any given ballot may include only 10 or 20 of them. When sampling ballots, some contests—especially those that appear on relatively few ballot styles—may be represented by very few sampled ballots, or none at all.
Jurisdictions handle this problem in different ways, but the common approach is to minimize the number of ballots examined. That typically means selecting a contest that appears on many ballot styles and has a relatively large margin. Colorado follows this approach and promotes its audits as a “gold standard.” In practice, however, this strategy provides limited assurance. It avoids testing many contests and does not justify the strong claims implied by the tight risk limits that are advertised. A more accurate description would be a fool’s gold standard.
In the present case, these multi-contest complications do not apply. However, other challenges remain.
An RLA audit can clarify who won, but not by how much
This election presents an ideal opportunity to conduct a risk-limiting audit, which is the most efficient method for confirming the election outcome—specifically, who won and who lost. But an RLA does not go further than that.
The reported margin of victory was 9 percent, compared to Trump’s 22 percent margin in the same district in 2024. Reducing that gap from 22 percent to 9 percent was obviously a rhetorical victory for Behn and her supporters. The unanswered question is whether the reported results are accurate.
Merely confirming that the winner was correctly identified is not sufficient here. An RLA will not determine whether Van Epps actually won by 9 percent, by a much larger margin such as 18 percent, or by a much smaller margin, say 4 percent. A risk-limiting audit is outcome-oriented, not margin-sensitive. It answers only one question: would a full hand count confirm the reported winner?
If the election were partially compromised, or if configuration errors reduced a true margin of 18 percent down to a reported 9 percent, an RLA would not detect that. Likewise, if the true margin were only 4 percent or even 2 percent, an RLA would still stop once it had sufficient evidence to confirm the winner, though it might require examining more ballots to do so, and the difference in the reported and actual margin would never be determined.
In both cases, the conclusion is the same: the audit would report that Van Epps won the election with 95 percent confidence, meaning that a full hand count (if conducted properly) would be expected to confirm that result in 19 out of 20 trials, but miss a flipped contest 5% of the time. What it cannot tell us is whether the reported margin accurately reflects the true level of voter support.
Ballot Image Audits (BIAs) can clarify the margin of victory
Because RLAs are not designed to measure margins precisely, a different approach is needed. Ballot Image Audits can process all ballots and determine whether the reported margin of victory is correct. While both RLAs and BIAs assume the underlying paper record is valid, BIAs examine every ballot image and can produce a highly accurate, independent tabulation.
Modern voting systems capture a digital image of each side of every paper ballot at relatively high resolution. These images are aligned and registered using image-processing techniques, and the marks are interpreted to create a cast vote record. This is a fundamentally different process from earlier systems that sampled only limited areas of the ballot to detect marks.
Because ballot images exist at the individual ballot level, they can be reprocessed independently to generate a full tabulation of the election. This allows verification not just of who won, but of the size of the win, if it was improperly tabulated, and that would obviously should trigger a full hand recount to verify the change of the margin.
Another important advantage of ballot image audits is that they can be conducted without handling the physical ballots and can be performed by an independent entity. For this purpose, the AuditEngine.org platform is available and well suited to the task.
BIA Feasibility in the 2025 TN 7th CD election
In this election, the MicroVote pushbutton machines with VVPAT do not produce ballot images. While it is technically possible to create images from the VVPAT tapes, doing so is difficult and requires processing the tapes, something only the election staff can do with a court order. Therefore, these machines are poorly suited for a ballot image audit conducted by an outsider.
By contrast, the other voting systems used in the district do produce ballot images and are readily auditable. AuditEngine can process these images directly, making those ballots the most accessible starting point for a ballot image audit, and most easily will be those from ES&S, as those are already easily processed.
Looking at the counties that make up the 7th Congressional District helps clarify what could be reasonable and feasible targets. The plot below arranges counties horizontally based on their partisan lean in the 2024 election, with more Democratic-leaning counties on the left and more Republican-leaning counties on the right.
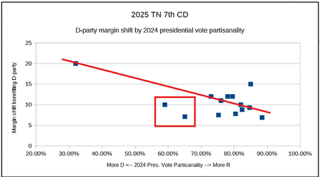
Across all counties in the district, there was a margin shift in favor of the Democratic candidate, Aftyn Behn. The observed shifts range from at least about 7 percentage points to as much as 20 points. In the plot, the shift is shown as the numerical change in margin relative to prior results, and should fall on the line if all counties experienced the same relative shift.
Only one county, Davidson, leans Democratic, with a 2024 partisan lean of roughly 21 percent Republican, or about 79 percent Democratic (far on the left). All other counties are Republican-leaning. Those counties generally show smaller shifts, though one tiny county, Perry, exhibits a shift of nearly 15 points.
I sketched a trend line through the data and noted what appear to be outliers. In the two boxed cases, the observed shift in favor of Behn is smaller than what the trend would suggest. The two counties that stand out are Montgomery and Williamson, with 2024 partisan leans of approximately 59 percent and 65 percent Republican, respectively.
Montgomery County uses MicroVote pushbutton/VVPAT machines and recorded 43,118 votes. If its shift had aligned with the trend seen in comparable counties, the margin would have increased by roughly 5 additional points in Behn’s favor. That corresponds to a margin shift of about 3,448 votes (which could be 1,724 votes flipped from Behn to Van Epps, or 3,448 votes improperly posted to Van Epps or not posted to Behn, or some combination, just to be clear about the number.
Williamson County shows a similar pattern. Instead of the observed 7-point shift, it might have exhibited a shift closer to 14 points, consistent with the trend line. That implies an additional 7-point margin shift, amounting to roughly 1938 votes shifted.
Combined, these two counties would account for approximately 5,386 additional votes for Behn, or roughly a 3 percent improvement overall. In that scenario, the reported loss margin would shrink from 9 percent to about 6 percent. Behn would not win, but the change in margin would still be of incredible interest.
These calculations are illustrative only. They are not claims of fraud or manipulation. They are rough estimates intended to identify where closer scrutiny would be most informative.
To test this hypothesis, a ballot image audit of Williamson County would be a logical next step. Approximately 28,000 votes were cast there, and auditing that county would be relatively straightforward for AuditEngine, assuming access to the ballot image data.
Some may argue that the election has already been certified and any audits are now moot. While certification deadlines matter, they are not absolute. There are precedents for elections being reconsidered after certification. If meaningful discrepancies are found, it would cast the entire election in a different light and could justify a full hand count of the VVPAT-based systems, as well as expanded ballot image audits of the ES&S, Unisyn, and Hart systems.
Agenda for Tennessee
We offer the following agenda items for TN and our oversight activities, to improve the auditability and verifiability of the result, and improve voter confidence.
• MicroVote pushbutton machines must be replaced immediately with hand-marked paper ballot systems.
• Hand-marked paper ballots can already be used with ES&S DS200 scanners without new purchases. ExpressVote machines should be limited to accessible voting only and hand-marked ballots used by all other voters, scanned directly by the DS-200 scanner. No new purchases, just use hand-marked ballots and avoid barcodes.
• Ballot images must be retained by default and made available for audit and public review.
• Auditing laws should be updated to require:
• All counties to participate
• All elections to be audited, including special and December elections
• All contests to be at least partially sampled
• A minimum of 1% of precincts, or 1% of absentee (mail) ballot batches
• Random selection of audit units after results are frozen
• Hand counts only, with no machine re-tabulation allowed
• Ballot Image Audits where ballot images exist, to verify margin accuracy
• Risk-limiting audits should be clearly specified in statute, with defined procedures rather than vague references.
• Ballot image audits should be explicitly authorized as an acceptable audit method.
• Our Action: Request ballot images and conduct a ballot image audit for at least Williamson County as a pilot and demonstration project.
What we’ve learned from Tennessee
• Tennessee presents a mixed landscape, ranging from obsolete pushbutton machines to strong hand-marked paper ballot systems. Similar mixtures exist in many states.
• Elections can be substantially improved by retiring legacy machines and standardizing on hand-marked ballots. In many cases (ES&S, Dominion) the scanners can already handle hand-marked ballots, and the only purchase may be ballot printers so ballots of any style can be printed on-demand.
• Audit practices are currently too limited to provide meaningful verification.
• Automated audits that rely on the same machines used in the election do not provide independent assurance and should be abandoned.
RLA Audits Can Verify Outcomes, but Not the Quality of the Win
This case shows that risk-limiting audits are valuable but insufficient on their own. RLAs can confirm whether the reported winner is correct, but they cannot determine whether the reported margin accurately reflects voter intent.
Ballot image audits go further. By examining all ballots, they can assess the quality of the win, not just its existence.
• All Posts: https://substack.com/@raylutz/posts
• Prior Post: https://open.substack.com/pub/raylutz/p/dominion-voting-systems-secretive “Dominion Voting Systems’ Secretive Buyout”
1
"BRAVO: Ballot-polling Risk-limiting Audits to Verify Outcomes" — https://www.usenix.org/system/files/conference/evtwote12/evtwote12-final27.pdf
2
A Gentle Introduction to Risk-limiting Audits by Mark Lindeman and Philip B. Stark: https://www.stat.berkeley.edu/~stark/Preprints/gentle12.pdfYou're currently a free subscriber to Ray Lutz. For the full experience, upgrade your subscription.

Summary of points in this article:
Creating a paper record can detect machine errors, but only if it is adequately checked
No audits were performed in TN for the Dec 2 election due to legal constraints.
The machines in TN include some of the worst, yet some of the best.
An RLA audit would be feasible in this election.
The Risk Limit in RLA audits is only about the sample sizes, not all risks.
The RLA audit would clarify who won and lost, but not by how much.
Ballot Image Audits (BIAs) can clarify whether the margin of victory was correct.
We should attempt to do a BIA of Williamson county
We must push for hand-marked ballots in 10 of these 14 counties, and retire the pushbutton with VVPAT machines.
In the future, all ballot images should be saved and made available for public review.
Creating a paper record can detect machine errors, but only if it is adequately checked
Paper ballots make verification possible only if someone actually looks at them. Without audits, the paper record functions largely as an emergency backup rather than an active safeguard. That backup role still matters because machines can fail catastrophically, but failing to examine ballots leaves the public with little more than trust in software-reported totals.
No Audits Are Being Performed in Tennessee for the December 2 Election
For the December 2 election, no audit is required by Tennessee law. The statutes mandate audits only for elections held in August and November, not for those conducted in December.
In practice, election officials interpret these provisions not merely as defining what must occur, but as setting the outer limits of what is permitted. If the code does not explicitly require an audit, it is treated as if audits are not allowed at all. As a result, even straightforward post-election verification is avoided.
The sections that follow examine Tennessee’s election audit statutes and explain how this interpretation has effectively eliminated audits for the December 2 election.
From the statutory language shown below, several additional limitations become clear. Even when audits are conducted, they involve only a small fraction of the state. Depending on the provision applied, just 3 or 6 counties out of 95 are selected for review.
The statute indicates that the Secretary of State selects these counties at random on election day. From an audit-design perspective, this timing is problematic. Ideally, selection should occur only after all results are finalized and frozen, so no county knows in advance whether it will be audited. Advance knowledge undermines the deterrent value of audits by allowing jurisdictions to anticipate scrutiny.
The code does not clearly specify when on election day the selection occurs. Given typical administrative practice, it is reasonable to assume the selection is made early, possibly at the start of the day. If so, counties would know well in advance whether their work will be reviewed, further weakening the audit’s effectiveness.
The next clip shows an additional constraint. In November elections, only a single contest is audited, either the presidential or gubernatorial race. In August elections, the audit is limited to the top county-level contest.
In each case, only one contest is examined, and election officials know in advance exactly which contest it will be. This advance certainty further limits the audit’s value, as it narrows both the scope of review and the uncertainty that audits are meant to introduce.
The workload is reduced even further by limiting the number of precincts audited. As shown below, counties audit either 1 or 5 precincts.
Only the 5 largest counties—Shelby, Davidson, Knox, Hamilton, and Rutherford—are classified as large counties and are required to audit 5 precincts. The remaining 90 counties, if selected at all, audit just a single precinct.
In practical terms, this produces extremely low coverage. In Shelby County, with approximately 907,000 residents and about 540,000 registered voters—roughly 400,000 of whom turn out—auditing 5 precincts amounts to coverage on the order of 0.1 percent. A more typical benchmark is closer to 1 percent.
A more defensible approach would scale the audit to a percentage of precincts rather than a fixed number, ensuring that audit coverage grows with county size rather than shrinking in relative terms.

The process then calls for one or more machines to retabulate the selected precincts. Critically, the machine used for this retabulation is one that was already used during early voting.
As a result, any configuration errors shared across machines would not be detected by this process. The audit does not introduce an independent tabulation method; it simply repeats the count using similar equipment.
Absentee and early-voted ballots are handled in the same manner, rescanned using scanners already deployed for that category. This further limits the audit’s ability to detect systematic errors affecting the original counts.

The process also assumes, implicitly, that all margins of victory exceed 1 percent. Discrepancies are not investigated unless the difference between the retabulation and the original results exceeds that threshold.
This creates a serious blind spot. Consider a contest decided by a 0.3 percent margin. If a retabulation using another machine differs from the original count by 0.5 percent, the reported outcome could be wrong. Yet because the discrepancy is below the 1 percent trigger, the results are still certified.
In close races, this policy allows potentially outcome-altering errors to pass without further review.
If they find a variance of more than 1%, then they can rescan 3% of those or other precincts using a different machine or do a hand count.
They also conduct performance audits, which verify that procedures were followed but do not examine election results.
Although risk-limiting audits are mentioned, the statutes provide no detail describing how such audits would be conducted.
Taken together, the weaknesses in Tennessee’s audit framework can be summarized as follows:
Audits are required only for August and November elections.
The December 2 election is therefore not audited at all.
Even when audits occur, only 3 or 6 counties participate, and those counties may be identified before polls close and before results are frozen, eliminating the element of surprise.
In November elections, only the gubernatorial or presidential contest is audited; in August elections, only the top county office on the ballot is reviewed. Other contests are not automatically checked, even though configuration errors or malicious interference could affect any contest in any county.
Within a selected county, only a small number of precincts are audited.
The audit consists of rescanning ballots using machines that were already used in the same election, likely with the same configuration and the same potential errors.
If the audit reveals discrepancies of up to 1 percent, no further action is required, even if the margin of victory is far smaller. While this is not a concern in the December 2 election, which had a 9 percent margin, it is critical in closer races.
If discrepancies exceed 1 percent, officials are only required to rescan the ballots again and possibly expand the audit to a few additional precincts. A hand count is never mandated.
The statutes do not provide a detailed or operational description of a risk-limiting audit.
The Machines Used in Tennessee Include Some of the Worst, Yet Some of the BestMachine Types
Tennessee uses a wide variety of voting systems, ranging from some of the most outdated technologies still in service to systems that are comparatively strong from an auditability standpoint.
At the low end are legacy DRE (direct-recording electronic) pushbutton machines. These systems do not produce conventional paper ballots and have instead been retrofitted with VVPAT devices, or Voter-Verifiable Paper Audit Trails. The VVPAT prints the voter’s selections onto a narrow paper tape, similar to a cash-register receipt. Voters can view this tape through a window, and in theory it can later be audited.
In practice, however, this assurance is largely illusory. If no audits are performed, the VVPAT serves no verification function at all. The paper exists, but it is never meaningfully examined.
Across the state’s 95 counties, roughly one-third still rely on these pushbutton systems, shown in red in the map below. Counties using ballot-marking devices with touch-screen interfaces that produce paper records containing barcodes are shown in yellow. Counties that primarily use hand-marked paper ballots—where voters darken ovals directly on the ballot—are shown in green.

This diversity of systems has direct consequences for auditability and public confidence, especially in the absence of mandatory post-election verification.
Tennessee’s 7th Congressional District includes 11 counties in their entirety and portions of 3 additional counties. The partial counties are clustered around Nashville in Davidson County and extend south into Williamson County.
Williamson County, a Democratic stronghold, is divided in a manner that appears designed to ensure the 7th District remains reliably controlled by the Republican Party. This configuration reflects the effects of partisan gerrymandering on the district’s composition and electoral outcomes.
See NYTimes summary here: https://www.nytimes.com/interactive/2025/12/02/us/elections/results-tennessee-us-house-7-special.html
Votes Cast % of total Machine type
65,367 36.32% MicroVote Infinity (DRE Pushbutton)
91,097 50.61% ES&S ExpressVote + DS200
11,947 6.64% Unisyn OpenElect Optical (OVO)
11,585 6.44% Hart Intercivic Verity Scan
MicroVote Infinity (DRE Pushbutton)
The worst of the systems used in the 7th Congressional District is the MicroVote Infinity, a pushbutton DRE machine that can be outfitted with a VVPAT (Voter Verifiable Paper Audit Trail) device. The VVPAT printer, visible just beyond the voter’s arm in the image below, produces a continuous paper tape recording the voter’s selections which the voter can verify when they vote.
If no one compares the VVPAT tape to the data uploaded into the Election Management System (EMS), the reported totals in the EMS can be altered without meaningful constraint. In this election, approximately 16,000 votes were reported for Van Epps over those reported for Behn. Given that 65,367 votes were cast on these machines, that outcome could easily be reversed by manipulation or misconfiguration affecting only a fraction of the totals.
Although the VVPAT is often described as providing a “paper record,” that assurance is meaningless when no audits are conducted. In this election, nothing is checked.
Even if officials wanted to examine ballots from the VVPAT tapes, doing so would be logistically difficult. A truly random selection would require generating a random index and physically counting forward on the tape to reach that ballot. Because the tape is continuous, it tends to unspool uncontrollably, making handling and preservation challenging. When California still permitted these systems, the law required a 100% hand count of the tapes. Some counties resorted to using custom jigs to keep the tape aligned while unrolling it from start to finish.
These machines do not produce ballot images, and creating them would require specialized scanners capable of handling continuous tape media and a lot of work.
For additional technical details on the MicroVote Infinity system, see: https://verifiedvoting.org/election-system/microvote-infinity/
ES&S ExpressVote BMDs + DS200 scanners
About half of the ballots in the 7th Congressional District across 6 counties were cast using a combination of ES&S ExpressVote ballot-marking devices and DS200 scanners.
The ExpressVote is a touch-screen BMD (ballot marking device). Voters make their selections using the on-screen interface, shown in the first image, and then print a ballot summary sheet. This is a narrow, half-sheet paper ballot containing both human-readable text and barcodes.

The printed summary sheet is then inserted into a DS200 scanner. The scanner reads the barcode to tabulate the vote and generates both aggregated totals for that machine and a ballot image of the summary sheet. At the close of voting, the memory card from each DS200 is removed and returned to the election office, where the results are uploaded into the Election Management System (EMS).
Because ballot images are created, these systems support ballot image audits, which can be used to compare reported results against recorded voter intent at scale.
There is one important caveat: these machines allow ballot image saving to be disabled. If that option is not enabled, the auditability advantage of this system is largely lost.

Even though there is a paper record and ballot images of this ballot that are created, if they are never reviewed, then again, the totals in the EMS can be changed without any limit.
Unisyn OpenElect Optical (OVO) and Hart Intercivic Verity Scan
The Unisyn OpenElect Optical (OVO) and the Hart Intercivic Verity Scan systems both use hand-marked paper ballots and represent the stronger end of the technology spectrum used in the district. Each accounts for roughly 6 percent of the vote, with Unisyn used in 1 county and Hart Intercivic used in 3 smaller counties.
These systems are similar in design and operation. They are not BMDs that rely on barcodes, and they are not DRE systems retrofitted with VVPAT devices. Voters mark paper ballots directly, which are then scanned optically. This is good.
Both systems produce ballot images, making them well suited for ballot image audits. From a technical standpoint, they support meaningful post-election verification.

Unisyn OpenElect Optical (OVO)

Hart Intercivic Verity Scan
Even so, sound technology alone does not ensure accuracy. Without audits, even the best systems provide no verified assurance that the reported results reflect voter intent.
An RLA Audit Would Be Feasible in This Election
With a reported margin of approximately 9 percent, this contest is especially well suited for a ballot-polling risk-limiting audit. Verifying the outcome—who won and who lost—would require examining only a small number of paper ballots.
A district-wide RLA would require on the order of 400 ballots drawn randomly across all or part of the 14 counties in the district. On average, that is about 29 ballots per county, with sample sizes ranging from roughly 4 ballots in the smallest counties to about 96 in the largest. This is a modest effort with a high return in assurance.
What a Risk-Limiting Audit Actually Does
A risk-limiting audit is a statistically guaranteed check of an election outcome. It is designed so that:
If the reported outcome is wrong, the audit has at most a small probability—called the risk limit—of failing to detect the error.
If the reported outcome is correct, the audit usually stops after examining only a small, random sample of ballots.
Unlike fixed-percentage audits, RLAs scale with the closeness of the race. Narrow margins require more ballots; wide margins require fewer.
In this contest, the margin is large enough that a ballot-polling RLA would conclude quickly.
The BRAVO¹ method uses this formula for estimating the expected number of ballots needed is:
Where:
alpha is the risk limit (commonly 5%)
m is the margin as a fraction (0.09)
For a 5% risk limit, the expected sample size is about 400 ballots district wide (14 counties)
For a 5 percent risk limit, the expected sample size is approximately 400 ballots district-wide, spread across 14 counties. This is an extraordinarily small burden for what it provides: statistical confirmation that the reported outcome is correct.
Why Audit a Race with a Large Margin?
This question comes up frequently, and the answer is straightforward:
Audits are not just for close races, they are for all races.
The purpose is to verify the process, not the competitiveness.
Conducting RLAs routinely builds institutional competence and public confidence.
Any problems uncovered (even small ones) help strengthen future elections.
In this election, the margin of victory in raw votes was about 16,000. Altering a computerized result does not require changing ballots; it only requires modifying a few numbers in a spreadsheet. Without audits, those numbers can be changed without detection.
Just as financial statements are audited every year regardless of profit margin, election results deserve verification in every cycle.
Paper Ballots Only Protect Elections If We Look at Them
Significant effort goes into securing paper ballots: controlled ballot stock, chain-of-custody procedures, sealed containers, and retention requirements. But these safeguards only matter if ballots are actually examined.
Without audits:
The paper record is unused.
Confidence depends on trusting software totals.
The public loses visibility into a process that should be open and verifiable.
With such a favorable statistical environment—large margin, small sample size, straightforward logistics—this election represents an unusually efficient opportunity to demonstrate a modern, evidence-based audit.
If the state does not conduct an RLA, the public loses:
A scientifically sound confirmation of results
An opportunity to normalize and refine best-practice audits
A moment to show that verification is routine, not exceptional
Audits are not about suspicion.
They are about good governance, transparency, and accountability.
The table below provides a convenient reference for estimating the number of samples required for a risk-limiting audit using the BRAVO ballot-polling method.
If there is any indication that the reported loser may in fact be the true winner, additional ballots will be required, potentially doubling the initial estimate. This reflects how RLAs respond to conflicting evidence by expanding the sample until the outcome is resolved
A technical note is important here. The BRAVO method simplifies the mathematics by assuming ballots are sampled with replacement, meaning the same ballot could theoretically be selected more than once. This assumption is used only for statistical convenience. In practice, ballots must never be resampled, or the audit could fail to converge if significant discrepancies are present.
The table also illustrates how sharply the required sample size increases as margins narrow. Margins above 2 percent require relatively modest samples, while margins below 2 percent grow rapidly. At a 9 percent margin, very few ballots are needed to confirm the outcome. Although the calculation yields an estimate of 370 ballots, it is prudent to plan for at least 10 percent more in the initial draw to avoid the need for additional sampling.
Margin 5% risk limit 10% risk limit 20% risk limit
0.01 29,957 23,026 16,094
0.02 7,489 5,757 4,023
0.03 3,329 2,558 1,788
0.04 1,872 1,439 1,006
0.05 1,198 921 644
0.06 832 639 447
0.07 612 470 329
0.08 468 360 252
0.09 370 284 199 ← This case
0.10 300 230 161

The method itself is straightforward. Ballots are randomly selected, and the vote on each sampled ballot is recorded and the margin calculated. After the initial sample is examined, the statistical risk is evaluated. If the calculated risk falls below the chosen limit, the audit stops.
In this case, the number of ballots drawn from each county would likely range from about 4 to 96, selected randomly from all ballots cast. The variation reflects differences in turnout, with roughly 1 ballot sampled for every 450 ballots cast across the district.
Conceptually, this is similar to an election poll, except that instead of asking voters how they voted, the audit examines the ballots themselves. Sampling continues only until the uncertainty is low enough to confirm the outcome. The key comparison is between the reported margin of victory and the margin observed in the sample, and the audit stops only when the evidence shows that the paper ballots support the computer-reported result.
Other RLA Methods Do Exist
There are several forms of risk-limiting audits, each with different requirements and efficiencies.
The method described above is known as a ballot-polling RLA. One advantage of this approach is that it does not require a cast vote record (CVR) that lists individual ballots. Ballots are sampled directly and interpreted by hand, making this method usable even in jurisdictions without ballot-level digital records.
If a jurisdiction can reliably match each paper ballot to its corresponding CVR, a ballot-comparison RLA² becomes possible. This method is generally more efficient, requiring fewer ballots, because it compares each sampled ballot directly against the machine-recorded vote.
Another commonly used approach is the batch-comparison audit. In this case, vote totals are compared at the batch level rather than ballot by ballot. Many election offices find this method easier to administer because it closely resembles a traditional recount process and aligns with existing procedures. However, it typically requires examining more ballots than a ballot-comparison audit.
“Risk Limit” does not limit all risks
It is important to understand what the term risk limit actually means. It does not mean that all risks are limited to that value. The risk limit applies only to the additional uncertainty introduced by sampling.
Because an RLA examines only a subset of ballots, there is some chance that the sample could indicate the outcome is correct when it is not. The stated risk limit bounds only that probability. It does not account for other sources of risk in the election process.
For example, RLAs do not address the risk that ballots were added or removed, that some ballots were never included in the count, or that ballots were altered while in storage. Paper marks could be changed by someone with access, such as darkening ovals or creating overvotes. Ballots could be invalid, or ballot boxes could be stuffed. The actual audit itself could be performed incorrectly. None of these risks are included in the RLA risk limit.
In that sense, RLAs can be thought of as “risk-taking audits.” The risk limit represents the additional risk accepted due to sampling, layered on top of all other risks that may already exist.
This is why RLAs must be part of a broader verification framework. Other risks must be reduced as much as possible through reconciliation checks, such as matching the number of ballots to the number of voters who signed in, verifying chain of custody, and enforcing secure storage. While it may be impossible to eliminate every risk, sampling risk should not be confused with total election risk.
Multiple Contests
This election contained only a single contest on the ballot. That simplicity makes the statistical analysis straightforward, because the required sample size depends only on the margin in that one race.
Most elections are far more complex. They can contain hundreds of contests, even though any given ballot may include only 10 or 20 of them. When sampling ballots, some contests—especially those that appear on relatively few ballot styles—may be represented by very few sampled ballots, or none at all.
Jurisdictions handle this problem in different ways, but the common approach is to minimize the number of ballots examined. That typically means selecting a contest that appears on many ballot styles and has a relatively large margin. Colorado follows this approach and promotes its audits as a “gold standard.” In practice, however, this strategy provides limited assurance. It avoids testing many contests and does not justify the strong claims implied by the tight risk limits that are advertised. A more accurate description would be a fool’s gold standard.
In the present case, these multi-contest complications do not apply. However, other challenges remain.
An RLA audit can clarify who won, but not by how much
This election presents an ideal opportunity to conduct a risk-limiting audit, which is the most efficient method for confirming the election outcome—specifically, who won and who lost. But an RLA does not go further than that.
The reported margin of victory was 9 percent, compared to Trump’s 22 percent margin in the same district in 2024. Reducing that gap from 22 percent to 9 percent was obviously a rhetorical victory for Behn and her supporters. The unanswered question is whether the reported results are accurate.
Merely confirming that the winner was correctly identified is not sufficient here. An RLA will not determine whether Van Epps actually won by 9 percent, by a much larger margin such as 18 percent, or by a much smaller margin, say 4 percent. A risk-limiting audit is outcome-oriented, not margin-sensitive. It answers only one question: would a full hand count confirm the reported winner?
If the election were partially compromised, or if configuration errors reduced a true margin of 18 percent down to a reported 9 percent, an RLA would not detect that. Likewise, if the true margin were only 4 percent or even 2 percent, an RLA would still stop once it had sufficient evidence to confirm the winner, though it might require examining more ballots to do so, and the difference in the reported and actual margin would never be determined.
In both cases, the conclusion is the same: the audit would report that Van Epps won the election with 95 percent confidence, meaning that a full hand count (if conducted properly) would be expected to confirm that result in 19 out of 20 trials, but miss a flipped contest 5% of the time. What it cannot tell us is whether the reported margin accurately reflects the true level of voter support.
Ballot Image Audits (BIAs) can clarify the margin of victory
Because RLAs are not designed to measure margins precisely, a different approach is needed. Ballot Image Audits can process all ballots and determine whether the reported margin of victory is correct. While both RLAs and BIAs assume the underlying paper record is valid, BIAs examine every ballot image and can produce a highly accurate, independent tabulation.
Modern voting systems capture a digital image of each side of every paper ballot at relatively high resolution. These images are aligned and registered using image-processing techniques, and the marks are interpreted to create a cast vote record. This is a fundamentally different process from earlier systems that sampled only limited areas of the ballot to detect marks.
Because ballot images exist at the individual ballot level, they can be reprocessed independently to generate a full tabulation of the election. This allows verification not just of who won, but of the size of the win, if it was improperly tabulated, and that would obviously should trigger a full hand recount to verify the change of the margin.
Another important advantage of ballot image audits is that they can be conducted without handling the physical ballots and can be performed by an independent entity. For this purpose, the AuditEngine.org platform is available and well suited to the task.
BIA Feasibility in the 2025 TN 7th CD election
In this election, the MicroVote pushbutton machines with VVPAT do not produce ballot images. While it is technically possible to create images from the VVPAT tapes, doing so is difficult and requires processing the tapes, something only the election staff can do with a court order. Therefore, these machines are poorly suited for a ballot image audit conducted by an outsider.
By contrast, the other voting systems used in the district do produce ballot images and are readily auditable. AuditEngine can process these images directly, making those ballots the most accessible starting point for a ballot image audit, and most easily will be those from ES&S, as those are already easily processed.
Looking at the counties that make up the 7th Congressional District helps clarify what could be reasonable and feasible targets. The plot below arranges counties horizontally based on their partisan lean in the 2024 election, with more Democratic-leaning counties on the left and more Republican-leaning counties on the right.

Across all counties in the district, there was a margin shift in favor of the Democratic candidate, Aftyn Behn. The observed shifts range from at least about 7 percentage points to as much as 20 points. In the plot, the shift is shown as the numerical change in margin relative to prior results, and should fall on the line if all counties experienced the same relative shift.
Only one county, Davidson, leans Democratic, with a 2024 partisan lean of roughly 21 percent Republican, or about 79 percent Democratic (far on the left). All other counties are Republican-leaning. Those counties generally show smaller shifts, though one tiny county, Perry, exhibits a shift of nearly 15 points.
I sketched a trend line through the data and noted what appear to be outliers. In the two boxed cases, the observed shift in favor of Behn is smaller than what the trend would suggest. The two counties that stand out are Montgomery and Williamson, with 2024 partisan leans of approximately 59 percent and 65 percent Republican, respectively.
Montgomery County uses MicroVote pushbutton/VVPAT machines and recorded 43,118 votes. If its shift had aligned with the trend seen in comparable counties, the margin would have increased by roughly 5 additional points in Behn’s favor. That corresponds to a margin shift of about 3,448 votes (which could be 1,724 votes flipped from Behn to Van Epps, or 3,448 votes improperly posted to Van Epps or not posted to Behn, or some combination, just to be clear about the number.
Williamson County shows a similar pattern. Instead of the observed 7-point shift, it might have exhibited a shift closer to 14 points, consistent with the trend line. That implies an additional 7-point margin shift, amounting to roughly 1938 votes shifted.
Combined, these two counties would account for approximately 5,386 additional votes for Behn, or roughly a 3 percent improvement overall. In that scenario, the reported loss margin would shrink from 9 percent to about 6 percent. Behn would not win, but the change in margin would still be of incredible interest.
These calculations are illustrative only. They are not claims of fraud or manipulation. They are rough estimates intended to identify where closer scrutiny would be most informative.
To test this hypothesis, a ballot image audit of Williamson County would be a logical next step. Approximately 28,000 votes were cast there, and auditing that county would be relatively straightforward for AuditEngine, assuming access to the ballot image data.
Some may argue that the election has already been certified and any audits are now moot. While certification deadlines matter, they are not absolute. There are precedents for elections being reconsidered after certification. If meaningful discrepancies are found, it would cast the entire election in a different light and could justify a full hand count of the VVPAT-based systems, as well as expanded ballot image audits of the ES&S, Unisyn, and Hart systems.
Agenda for Tennessee
We offer the following agenda items for TN and our oversight activities, to improve the auditability and verifiability of the result, and improve voter confidence.
MicroVote pushbutton machines must be replaced immediately with hand-marked paper ballot systems.
Hand-marked paper ballots can already be used with ES&S DS200 scanners without new purchases. ExpressVote machines should be limited to accessible voting only and hand-marked ballots used by all other voters, scanned directly by the DS-200 scanner. No new purchases, just use hand-marked ballots and avoid barcodes.
Ballot images must be retained by default and made available for audit and public review.
Auditing laws should be updated to require:
All counties to participate
All elections to be audited, including special and December elections
All contests to be at least partially sampled
A minimum of 1% of precincts, or 1% of absentee (mail) ballot batches
Random selection of audit units after results are frozen
Hand counts only, with no machine re-tabulation allowed
Ballot Image Audits where ballot images exist, to verify margin accuracy
Risk-limiting audits should be clearly specified in statute, with defined procedures rather than vague references.
Ballot image audits should be explicitly authorized as an acceptable audit method.
Our Action: Request ballot images and conduct a ballot image audit for at least Williamson County as a pilot and demonstration project.
What we’ve learned from Tennessee
Tennessee presents a mixed landscape, ranging from obsolete pushbutton machines to strong hand-marked paper ballot systems. Similar mixtures exist in many states.
Elections can be substantially improved by retiring legacy machines and standardizing on hand-marked ballots. In many cases (ES&S, Dominion) the scanners can already handle hand-marked ballots, and the only purchase may be ballot printers so ballots of any style can be printed on-demand.
Audit practices are currently too limited to provide meaningful verification.
Automated audits that rely on the same machines used in the election do not provide independent assurance and should be abandoned.
RLA Audits Can Verify Outcomes, but Not the Quality of the Win
This case shows that risk-limiting audits are valuable but insufficient on their own. RLAs can confirm whether the reported winner is correct, but they cannot determine whether the reported margin accurately reflects voter intent.
Ballot image audits go further. By examining all ballots, they can assess the quality of the win, not just its existence.
• All Posts: https://substack.com/@raylutz/posts
• Prior Post: https://open.substack.com/pub/raylutz/p/dominion-voting-systems-secretive “Dominion Voting Systems’ Secretive Buyout”
1
"BRAVO: Ballot-polling Risk-limiting Audits to Verify Outcomes" — https://www.usenix.org/system/files/conference/evtwote12/evtwote12-final27.pdf
2
A Gentle Introduction to Risk-limiting Audits by Mark Lindeman and Philip B. Stark: https://www.stat.berkeley.edu/~stark/Preprints/gentle12.pdfYou're currently a free subscriber to Ray Lutz. For the full experience, upgrade your subscription.